
Description
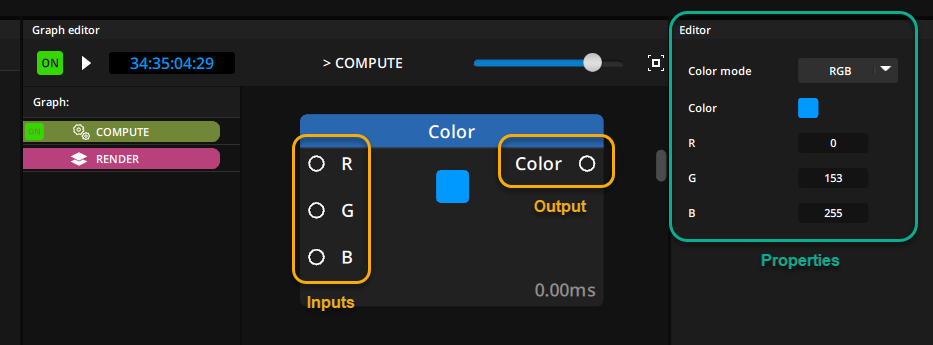
The Graph Editor is a powerful and flexible workspace where you connect nodes together using inputs and outputs.
It is, in a sense, a graphical programming interface where you can also drag & drop many other properties from other workspaces of KInetic Designer such as Devices, Variables, 3D items, timeline properties, etc.
If you have already worked with Node editors in other software before then you should be familiar with the basic workflow of these types of editors.
Graph types
Modulo Kinetic has two types of Graphs : Compute graphs and Render graphs.
Compute graphs

Compute Graphs are closely related to the show in which they are created and are not meant to be shared around in design workflows or imported into other shows.
They are comprised of a number of basic and advanced building nodes and are purposed to create meaningful computation of your data with a great variety of tools at your disposal.
For this purpose, it is possible to drag & drop properties from other workspaces (Devices, Variables, 3D items, etc.) into your compute graphs and a pop-up window will let you choose what to link in the graph for that property.
Render graphs

On the other hand, Render Graphs are designed to act like stand-alone programs that create visual effect. They are meant to be easily shared around in design workflows between content creators, design artists, and technical integrators.
They are also designed to be simple to export from one show and import into another.
For this purpose, it is not possible to drag & drop media and properties from other workspaces directly into your render graph.
Instead, instances of a render graph can be created by drag & dropping it into the timeline, and you can connect each of these instances to variables, media, etc. To do so, inputs must be created on its design.
More information on linking instances of render graphs and a video memo can be found in the Render Graph Tutorial series.
Properties
Nodes can be created by either drag&dropping them from the toolbox on the right of the Graph Editor, or by right-clicking inside the graph to access the node list directly at the cursor’s position.
In the following manual pages, the Properties section refers to properties that are available in the Editor panel when a node is selected.
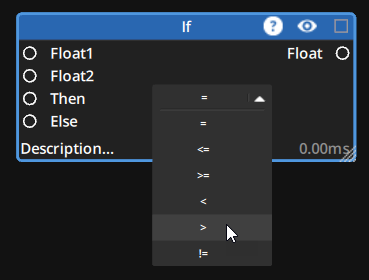
For some nodes, some properties can also be directly input on the node itself, often with a dropdown menu. For example on the If node, the operator can be chosen directly on the node :
To change the value of a property, whether it is in the Editor panel or directly on the node you can :
- left click and input your value
- left click and hold and then drag left to increase or right to decrease the value.
- Holding down
SHIFTwhile doing so will increase the speed - Holding down
CTRLwill increase precision.
- Holding down
Graph Timecodes
Both types of graph have a timecode, but only Compute graphs have an  button to toggle it ON/OFF.
Graphs can be set to either run or pause by toggling the  or
or  button next to the timecode.
Any node or property that is meant to evaluate or change over time will be stopped if the graph is paused, but tracking data from sensors will still be updated and if media present in a paused render graphs are set to freerun they will still be played.
Node customization
Rename
Double click on any node’s title to rename it.
Colorize nodes
Color-code your nodes using the color wheel accessible in the top right corner of each node.
Colorize noodles
Color-code your noodles connecting your nodes by left clicking on any input or output, once it is connected.
It is generally easier to colorize a noodle using an output rather than an input as a small click & drag while trying to access the color wheel can disconnect your nodes.
Need more help with this?
Don’t hesitate to contact us here.